Cloud
Automated Cloud Monitoring Solution via DevOps Pipelines for Multi-Account AWS Environments
As organizations grow and expand their cloud infrastructure, managing and monitoring multiple AWS accounts becomes increasingly complex. Manual processes are not only time-consuming but also prone to errors and inconsistencies. This white paper introduces an automated cloud monitoring solution that leverages AWS CloudWatch and DevOps pipelines to streamline the deployment of monitoring across multiple AWS accounts. The solution minimizes manual effort, reduces errors, and enhances consistency, while ensuring scalability and security compliance. It offers significant operational and cost benefits for enterprises managing large cloud environments.
Insights
- Implementation of a centralized, automated monitoring system across AWS environments.
- Use of CI/CD pipelines for consistent deployment, ensuring scalability and automation.
- Integration with AWS Systems Manager and Amazon CloudWatch for real-time operational insights.
- Minimal manual intervention due to the use of GitLab and Terraform automation.
- Advanced log analysis and alerting capabilities through integration with third-party tools like Splunk.
Introduction
Effective monitoring is crucial for maintaining the reliability and security of cloud infrastructures, especially in multi-account environments. However, manually configuring monitoring for multiple AWS accounts can be challenging and inefficient. Without automation, the process is error-prone, inconsistent, and difficult to scale. This white paper presents a fully automated cloud monitoring solution designed to streamline monitoring for multi-account AWS environments through a DevOps pipeline approach.
Problem Statement
In large-scale cloud environments, managing monitoring across hundreds of AWS accounts presents a significant challenge. The manual configuration of monitoring systems, such as AWS CloudWatch, across multiple accounts is time-consuming and often leads to inconsistencies and errors. This introduces delays, increases the risk of missed alerts, and impacts overall reliability. The lack of automation also limits scalability and hinders effective monitoring, resulting in inefficiencies. A solution is required to automate the setup and configuration of monitoring systems across multiple accounts, ensuring consistency and reliability.
Solution Overview
The automated cloud monitoring solution is designed to address the challenges of configuring and managing monitoring in multi-account AWS environments. By leveraging AWS CloudWatch for monitoring and alerting, combined with a DevOps pipeline, the solution enables the centralized and consistent deployment of monitoring across multiple AWS accounts. The solution automates the entire process, from configuration to deployment, reducing manual effort and eliminating errors. This approach enhances the reliability and scalability of monitoring systems while ensuring that all accounts are efficiently monitored.
Architecture and Design
The architecture of the automated cloud monitoring solution is designed to provide a centralized, scalable, and secure way to manage monitoring across multiple AWS accounts. It utilizes AWS CloudWatch as the core monitoring service, integrated with Infrastructure as Code (IaC) tools like Terraform and a CI/CD pipeline built using GitLab to automate deployments. Below is a detailed breakdown of the architecture and its components.
Core Components Overview
AWS CloudWatch
- Purpose: Acts as the primary monitoring and logging service, collecting real-time data, metrics, and logs from AWS resources across all accounts.
- Features Utilized:
- CloudWatch Metrics: Tracks and visualizes data points like CPU utilization, memory usage, and network activity for AWS services.
- CloudWatch Alarms: Configures automated alarms based on metric thresholds to trigger alerts or corrective actions.
- CloudWatch Logs: Aggregates and stores logs from various services to analyse system performance and troubleshoot issues.
Terraform
- Purpose: Used to define, deploy, and manage AWS infrastructure as code, ensuring that infrastructure setups are consistent and repeatable.
- Terraform Modules:
- CloudWatch Setup Module: Automates the creation of CloudWatch alarms, dashboards, and metric filters.
- IAM Role Configuration Module: Sets up roles and policies to control permissions securely across accounts.
- Resource Provisioning Module: Automates the provisioning of AWS resources needed for monitoring, such as SNS topics for alarm notifications.
GitLab CI/CD Pipeline
- Purpose: Automates the deployment of monitoring configurations using continuous integration and continuous delivery principles.
- Pipeline Stages:
- Terraform Plan Stage: Runs Terraform commands to validate and generate the infrastructure plan.
- Terraform Apply Stage: Automatically provisions and deploys the CloudWatch configurations to multiple AWS accounts.
- Testing and Validation Stage: Verifies the integrity and consistency of deployments across accounts before finalizing changes.
IAM Roles and Policies
- Purpose: Ensures secure access to AWS resources and controls permissions for monitoring services.
- Implementation:
- Cross-Account Access: Configures IAM roles that allow secure cross-account access, ensuring centralized control.
- Least Privilege Principle: Applies strict permission settings to limit access only to necessary resources, enhancing security.
Complete Automation Flow
- Continuous Monitoring: Metrics and log data are captured by CloudWatch agents and transmitted to CloudWatch for monitoring.
- Alarms: CloudWatch triggers alarms when predefined thresholds are breached (e.g., CPU or memory usage).
- Third-Party Tool Integration: Alerts can be sent to external tools like Splunk for deeper analysis through AWS services such as Kinesis Firehose and Lambda.
- Centralized Monitoring: CloudWatch Observability Access Manager allows for centralized monitoring across multiple AWS accounts.
Figure 1: Representational Image title
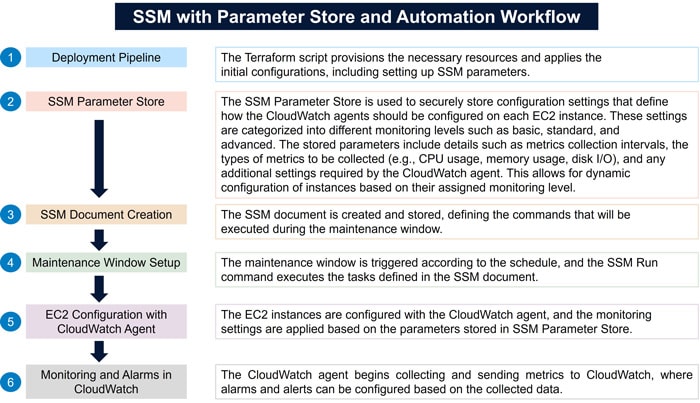
This section details the architecture of the automated cloud monitoring solution as depicted in the diagram. The solution is designed to efficiently manage and monitor AWS EC2 instances by utilizing a combination of Infrastructure as Code (IaC), AWS native services, and external analytics tools. The integration of Terraform, GitLab, AWS Systems Manager, and AWS CloudWatch plays a crucial role in ensuring a streamlined, automated, and scalable approach to monitoring both Linux and Windows workloads.
Figure 2: Architecture of this centralized monitoring solution
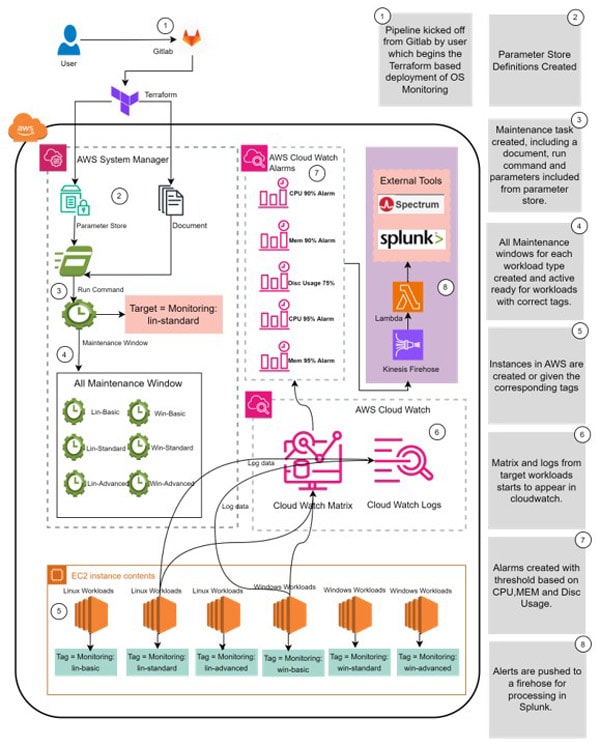
Below is a step-by-step explanation of the workflow, illustrating each component’s function and interaction within the solution.
Step 1: Pipeline Initialization
The monitoring deployment process begins with a user-triggered event in GitLab, initiating the DevOps pipeline. This process leverages Terraform to automate the provisioning of infrastructure components essential for OS-level monitoring within the AWS environment. The use of GitLab CI/CD ensures a consistent and repeatable deployment, minimizing manual intervention and errors.
Step 2: Terraform Deployment to AWS Systems Manager
Terraform serves as the core automation tool, configuring AWS Systems Manager to handle system configurations. It sets up the Parameter Store, which securely stores and manages system parameters required for monitoring. Terraform also generates and deploys Run Command documents within AWS Systems Manager, defining the specific scripts and commands to be executed on target EC2 instances.
Step 3: Maintenance Window Setup
AWS Systems Manager then establishes a Maintenance Window, defining the schedule and conditions under which monitoring tasks are to be executed on the EC2 instances. This window is aligned with specific target workloads, categorized by predefined tags such as lin-standard or win-advanced. This ensures that monitoring operations are conducted in a controlled and predictable manner, aligning with organizational maintenance schedules.
Step 4: Instance Tagging and Targeting
EC2 instances are systematically tagged according to their workload categories, such as lin-basic, lin-standard, lin-advanced for Linux instances and win-basic, win-standard, win-advanced for Windows instances. These tags facilitate precise targeting, enabling the automated system to apply the appropriate monitoring configurations to each instance based on its operational requirements.
Step 5: Execution of Monitoring Commands
During the designated maintenance windows, AWS Systems Manager executes the predefined commands on the targeted EC2 instances using the Run Command feature. This operation triggers the collection of critical performance metrics and logs, which are then transmitted to AWS CloudWatch. This step is crucial for gathering real-time data that drives the monitoring and alerting mechanisms.
Step 6: Data Aggregation in AWS CloudWatch
AWS CloudWatch acts as the central repository for the collected metrics and log data from all targeted workloads. It aggregates the data, enabling the visualization of key performance indicators (KPIs) and trends within a unified dashboard. CloudWatch's capabilities ensure that insights into resource utilization and system health are readily accessible for proactive management.
Step 7: Alarm Creation and Triggering
Based on the collected metrics, AWS CloudWatch generates alarms that are configured to activate when specific thresholds are met, such as high CPU utilization, memory consumption, or disk space usage. These alarms are designed to trigger immediate notifications or initiate automated response actions, thus enabling quick remediation of any detected issues.
Step 8: Alert Processing and Integration with External Tools
Triggered alarms in CloudWatch initiate data transfers to Amazon Kinesis Firehose, which subsequently routes the data to AWS Lambda for processing. The processed alerts are then integrated with external monitoring tools like Splunk and Spectrum. These tools provide enhanced analytics, advanced incident management capabilities, and deeper insights into system performance, ensuring that all alerts are effectively managed and acted upon.
Solution Implementation
To implement the solution, certain prerequisites and step-by-step procedures must be followed:
Prerequisites
- All the EC2 instances should have SSM agent installed. (This can be ensured at the time of Golden Image creation. All the project teams should be forced to use Golden images only)
- GitLab CICD parameters (e.g. account ID, credentials etc) should be updated so that this automation can be run on target accounts (self-service or managed accounts)
- Credentials used in Gitlab should have admin privileges or equivalent to deploy IAM roles, run cloud formation template, Lambda function and SSM. (recommend using Admin credentials for simplicity)
Following AWS IAM Instance Role must be attached to the EC2 instance\ System manager and CloudWatch requires an EC2 service IAM role to be created. The policy AmazonEC2RoleforSSM & CloudWatchAgentServerPolicy needs to be added to the role ccCloudRoleSSM to allow System manager to manage instances and for Monitoring data to be ingested in CloudWatch. included below is a table which shows the relationship between Role and attached Polices. this can be updated in GitLab if more polices are required.Role Attached Polices Trusted Services ccCloudRoleSSM "arn:aws:iam::aws:policy/CloudWatchAgentServerPolicy", "ec2.amazonaws.com", "arn:aws:iam::aws:policy/AmazonSSMManagedInstanceCore" "ssm.amazonaws.com", "cloudwatch.amazon.com" - Instances should follow the right tagging for enabling this automation. Project teams should be educated to follow the right tagging standards.
- One of the following tags must be used based on the project requirement.
- "monitoring:lin-basic"
- "monitoring:lin-standard"
- "monitoring:lin-advanced"
- "monitoring:win-basic"
- "monitoring:win-standard"
- "monitoring:win-advanced"
- Below are the mandatory tags that need to be associated to each of the EC2 instances.
- Tag Key - Create_Auto_Alarms, Tag Value - empty

- One of the following tags must be used based on the project requirement.
Step-by-Step Implementation
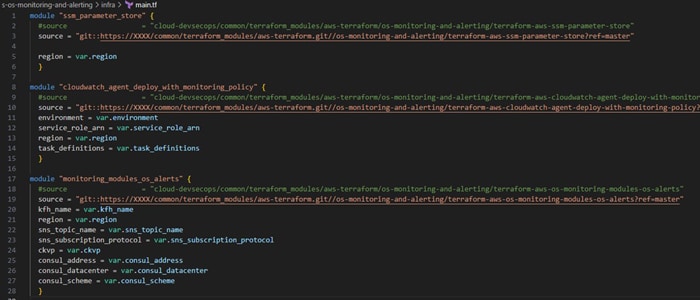
Main.tf will make calls to the wrapper modules in sequence as below. All the variables are passed to main.tf file using. tfvar file
Note: Below code is just an example, you might have to reconfigure the code as per your requirements.
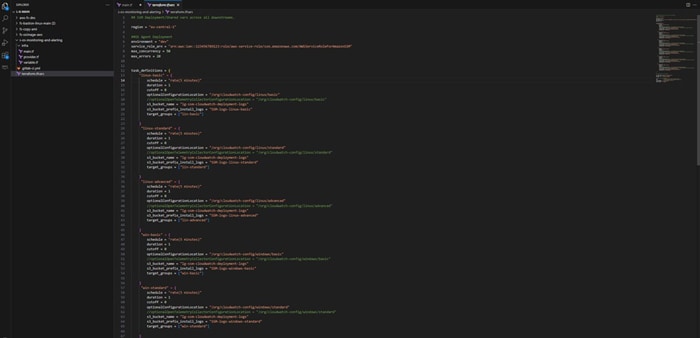
Below is the sample. TFVAR file.
Below steps cover the details of each module being called in the main.tf above.
Step 1: Configure the SSM Parameter Store with CloudWatch agent settings for EC2 instances:
AWS Systems Manager Parameter Store is used to store configuration settings for Amazon CloudWatch agents on EC2 instances.
Linux Configurations:
| Basic Configuration: | Standard Configuration: | Advanced Configuration: |
|---|---|---|
| Captures minimal metrics such as disk usage and memory utilization. json Copy code { "agent": { "metrics_collection_interval": 30, "run_as_user": "root" }, "metrics": { "append_dimensions": { "AutoScalingGroupName": "${aws:AutoScalingGroupName}", "ImageId": "${aws:ImageId}", "InstanceId": "${aws:InstanceId}", "InstanceType": "${aws:InstanceType}" }, "metrics_collected": { "disk": { "measurement": ["used_percent"], "metrics_collection_interval": 30, "resources": ["*"] }, "mem": { "measurement": ["mem_used_percent"], "metrics_collection_interval": 30 } } } } |
Includes additional metrics like CPU utilization and disk I/O statistics. json Copy code { "agent": { "metrics_collection_interval": 30, "run_as_user": "root" }, "metrics": { "append_dimensions": { "AutoScalingGroupName": "${aws:AutoScalingGroupName}", "ImageId": "${aws:ImageId}", "InstanceId": "${aws:InstanceId}", "InstanceType": "${aws:InstanceType}" }, "metrics_collected": { "cpu": { "measurement": [ "cpu_usage_idle", "cpu_usage_iowait", "cpu_usage_user", "cpu_usage_system" ], "metrics_collection_interval": 30, "resources": ["*"] }, "disk": { "measurement": ["used_percent", "inodes_free"], "metrics_collection_interval": 30, "resources": ["*"] }, "diskio": { "measurement": ["io_time"], "metrics_collection_interval": 30, "resources": ["*"] }, "mem": { "measurement": ["mem_used_percent"], "metrics_collection_interval": 30 }, "swap": { "measurement": ["swap_used_percent"], "metrics_collection_interval": 30 } } } } |
Provides detailed metrics, including CPU, disk, memory, and network statistics. json Copy code { "agent": { "metrics_collection_interval": 10, "run_as_user": "root" }, "metrics": { "append_dimensions": { "AutoScalingGroupName": "${aws:AutoScalingGroupName}", "ImageId": "${aws:ImageId}", "InstanceId": "${aws:InstanceId}", "InstanceType": "${aws:InstanceType}" }, "metrics_collected": { "cpu": { "measurement": [ "cpu_usage_idle", "cpu_usage_iowait", "cpu_usage_user", "cpu_usage_system" ], "metrics_collection_interval": 10, "resources": ["*"] }, "disk": { "measurement": ["used_percent", "inodes_free"], "metrics_collection_interval": 10, "resources": ["*"] }, "diskio": { "measurement": [ "io_time", "write_bytes", "read_bytes", "writes", "reads" ], "metrics_collection_interval": 10, "resources": ["*"] }, "mem": { "measurement": ["mem_used_percent"], "metrics_collection_interval": 10 }, "netstat": { "measurement": [ "tcp_established", "tcp_time_wait" ], "metrics_collection_interval": 10 }, "swap": { "measurement": ["swap_used_percent"], "metrics_collection_interval": 10 } } } } |
Windows Configurations:
| Basic Configuration: | Standard Configuration: | Advanced Configuration: |
|---|---|---|
| Focuses on key metrics like logical disk space and memory usage. json Copy code { "logs": { "logs_collected": { "windows_events": { "collect_list": [ { "event_format": "xml", "event_levels": [ "WARNING", "ERROR", "CRITICAL" ], "event_name": "System", "log_group_name": "System", "log_stream_name": "{instance_id}" } ] } } }, "metrics": { "append_dimensions": { "AutoScalingGroupName": "${aws:AutoScalingGroupName}", "ImageId": "${aws:ImageId}", "InstanceId": "${aws:InstanceId}", "InstanceType": "${aws:InstanceType}" }, "metrics_collected": { "LogicalDisk": { "measurement": ["% Free Space"], "metrics_collection_interval": 30, "resources": ["*"] }, "Memory": { "measurement": ["% Committed Bytes In Use"], "metrics_collection_interval": 30 } } } } |
Adds CPU and physical disk metrics to the basic configuration. json Copy code { "logs": { "logs_collected": { "windows_events": { "collect_list": [ { "event_format": "xml", "event_levels": [ "WARNING", "ERROR", "CRITICAL" ], "event_name": "System", "log_group_name": "System", "log_stream_name": "{instance_id}" } ] } } }, "metrics": { "append_dimensions": { "AutoScalingGroupName": "${aws:AutoScalingGroupName}", "ImageId": "${aws:ImageId}", "InstanceId": "${aws:InstanceId}", "InstanceType": "${aws:InstanceType}" }, "metrics_collected": { "LogicalDisk": { "measurement": ["% Free Space"], "metrics_collection_interval": 30, "resources": ["*"] }, "Memory": { "measurement": ["% Committed Bytes In Use"], "metrics_collection_interval": 30 }, "PhysicalDisk": { "measurement": [ "% Disk Time", "Disk Write Bytes/sec", "Disk Read Bytes/sec", "Disk Writes/sec", "Disk Reads/sec" ], "metrics_collection_interval": 30, "resources": ["*"] }, "Processor": { "measurement": [ "% User Time", "% Idle Time", "% Interrupt Time" ], "metrics_collection_interval": 30, "resources": ["*"] } } } } |
Captures detailed event logs, CPU, disk, memory, and network metrics. json Copy code { "logs": { "logs_collected": { "windows_events": { "collect_list": [ { "event_format": "xml", "event_levels": [ "VERBOSE", "INFORMATION", "WARNING", "ERROR", "CRITICAL" ], "event_name": "System", "log_group_name": "System", "log_stream_name": "{instance_id}" } ] } } }, "metrics": { "append_dimensions": { "AutoScalingGroupName": "${aws:AutoScalingGroupName}", "ImageId": "${aws:ImageId}", "InstanceId": "${aws:InstanceId}", "InstanceType": "${aws:InstanceType}" }, "metrics_collected": { "LogicalDisk": { "measurement": ["% Free Space"], "metrics_collection_interval": 30, "resources": ["*"] }, "Memory": { "measurement": ["% Committed Bytes In Use"], "metrics_collection_interval": 30 }, "Paging File": { "measurement": ["% Usage"], "metrics_collection_interval": 30, "resources": ["*"] }, "PhysicalDisk": { "measurement": [ "% Disk Time", "Disk Write Bytes/sec", "Disk Read Bytes/sec", "Disk Writes/sec", "Disk Reads/sec" ], "metrics_collection_interval": 30, "resources": ["*"] }, "Processor": { "measurement": [ "% User Time", "% Idle Time", "% Interrupt Time" ], "metrics_collection_interval": 30, "resources": ["*"] }, "TCPv4": { "measurement": ["Connections Established"], "metrics_collection_interval": 30 }, "TCPv6": { "measurement": ["Connections Established"], "metrics_collection_interval": 30 } } } } |
Example: Configurations needs to be in JSON format as described below. Create separate configurations for basic, advanced and standard. Configurations are also listed in the table above.
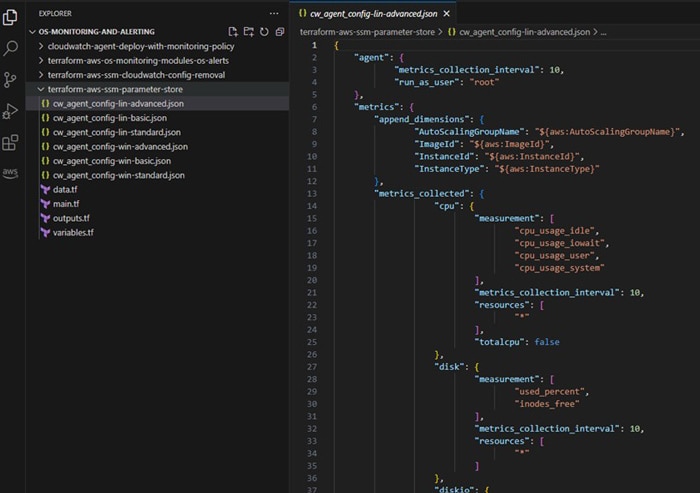
Main.tf file under ‘terraform-aws-ssm-parameter-store’ will contain the n number of resource blocks of “aws_ssm_parameter” based on number of operating system versions and configuration types (basic, standard and advanced).
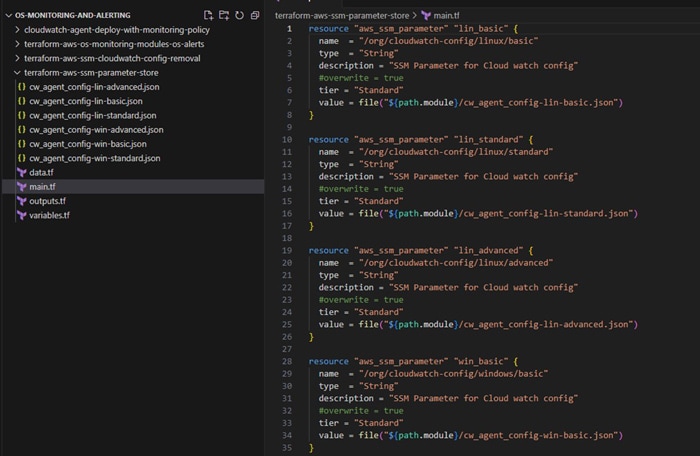
Step 2: Set up maintenance windows using SSM: SSM Maintenance Windows allow you to define schedules for deploying Amazon CloudWatch agents across EC2 instances. You can configure maintenance windows using Terraform scripts and define tasks within these windows to deploy agents based on instance tags.
Below terraform resource blocks can be used to create ssm maintenance windows, tasks and targets.
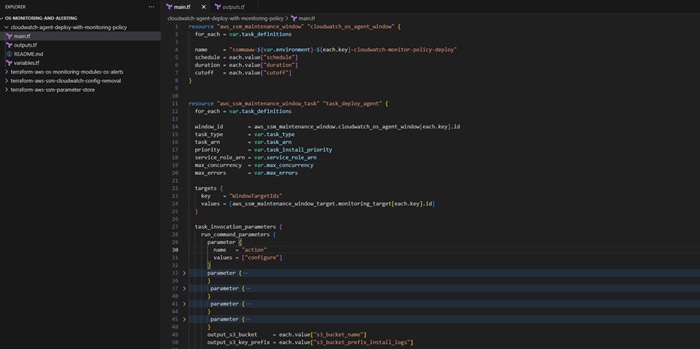
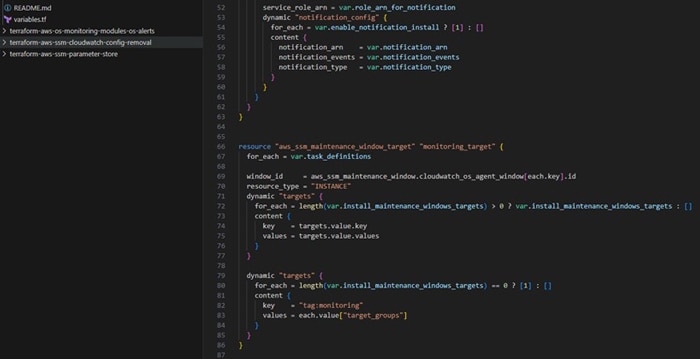
Step 3: Deploy a CloudFormation stack for alarm management: To manage alarms and handle instance state changes, deploy a CloudFormation stack that creates Lambda functions and Amazon CloudWatch alarms. The Lambda function will create alarms based on event triggers, such as instance state changes.
Test Cases & Scenarios
Linux Basic Monitoring
| SNO | Description | Expected Result | ||||||||
|---|---|---|---|---|---|---|---|---|---|---|
| 1 | Step 1: Provision Linux machine and apply the following tags
|
In CloudWatch alarms, we should be able to see the alarms created with following name AutoAlarm-Instance-id-AWS* | ||||||||
| 2 | Goto CloudWatch and Choose "Filter by Resource Group", select value as "test-monitoring-lin-basic" Note: Resource Groups should be created beforehand. |
Filtered resources should be listed in CloudWatch dashboard | ||||||||
| 3 | Check the EC2 dashboard, there will be some data in graphs | CloudWatch Dashboard should show some metrics. | ||||||||
| 4 | Run the Stress on the EC2 machine tagged with monitoring:lin-basic, stress should 100% of cpu or memory utilization. Connect to Your EC2 Instance: Use SSH to connect to your EC2 instance. You can use the private key you used to launch the instance. sudo apt-get update sudo apt-get install stress stress --cpu 4 --timeout 60s |
Alarm should trigger on defined thresholds. |
Linux Standard Monitoring
| SNO | Description | Expected Result | ||||||||
|---|---|---|---|---|---|---|---|---|---|---|
| 1 | Step 1: Provision Linux machine and apply the following tags
|
In CloudWatch alarms, we should be able to see the alarms created with following name AutoAlarm-Instance-id-AWS* | ||||||||
| 2 | Goto CloudWatch and Choose "Filter by Resource Group", select value as "test-monitoring-lin-standard" Note: Resource Groups should be created beforehand. |
Filtered resources should be listed in CloudWatch dashboard | ||||||||
| 3 | Check the EC2 dashboard, there will be some data in graphs | CloudWatch Dashboard should show some metrics. | ||||||||
| 4 | Run the Stress on the EC2 machine tagged with monitoring:lin-standard, stress should 100% of CPU or memory utilization. Connect to Your EC2 Instance: Use SSH to connect to your EC2 instance. You can use the private key you used to launch the instance. sudo apt-get update sudo apt-get install stress stress --cpu 4 --timeout 60s |
Alarm should trigger on defined thresholds. |
Linux Advanced Monitoring
| SNO | Description | Expected Result | ||||||||
|---|---|---|---|---|---|---|---|---|---|---|
| 1 | Step 1: Provision Linux machine and apply the following tags
|
In CloudWatch alarms, we should be able to see the alarms created with following name AutoAlarm-Instance-id-AWS* | ||||||||
| 2 | Goto CloudWatch and Choose "Filter by Resource Group", select value as "test-monitoring-lin-advanced" Note: Resource Groups should be created beforehand. |
Filtered resources should be listed in CloudWatch dashboard | ||||||||
| 3 | Check the EC2 dashboard, there will be some data in graphs | CloudWatch Dashboard should show some metrics. | ||||||||
| 4 | Run the Stress on the EC2 machine tagged with monitoring:lin-advanced, stress should 100% of cpu or memory utilization. Connect to Your EC2 Instance: Use SSH to connect to your EC2 instance. You can use the private key you used to launch the instance. sudo apt-get update sudo apt-get install stress stress --cpu 4 --timeout 60s |
Alarm should trigger on defined thresholds. |
Windows Basic Monitoring
| SNO | Description | Expected Result | ||||||||
|---|---|---|---|---|---|---|---|---|---|---|
| 1 | Step 1: Provision windows machine and apply the following tags
|
In CloudWatch alarms, we should be able to see the alarms created with following name AutoAlarm-Instance-id-AWS* | ||||||||
| 2 | Goto CloudWatch and Choose "Filter by Resource Group", select value as "test-monitoring-win-basic" Note: Resource Groups should be created beforehand. |
Filtered resources should be listed in CloudWatch dashboard | ||||||||
| 3 | Check the EC2 dashboard, there will be some data in graphs | CloudWatch Dashboard should show some metrics. | ||||||||
| 4 | Run the Stress on the EC2 machine tagged with monitoring:win-basic, stress should 100% of cpu or memory utilization. Connect to Your EC2 Instance: Use RDP to connect to your EC2 instance. Download stress test software’s like Prime95 and run the stress test. |
Alarm should trigger on defined thresholds. |
Windows Standard Monitoring
| SNO | Description | Expected Result | ||||||||
|---|---|---|---|---|---|---|---|---|---|---|
| 1 | Step 1: Provision windows machine and apply the following tags
|
In CloudWatch alarms, we should be able to see the alarms created with following name AutoAlarm-Instance-id-AWS* | ||||||||
| 2 | Goto CloudWatch and Choose "Filter by Resource Group", select value as "test-monitoring-win-standard" Note: Resource Groups should be created beforehand. |
Filtered resources should be listed in CloudWatch dashboard | ||||||||
| 3 | Check the EC2 dashboard, there will be some data in graphs | CloudWatch Dashboard should show some metrics. | ||||||||
| 4 | Run the Stress on the EC2 machine tagged with monitoring:win-standard, stress should 100% of cpu or memory utilization. Connect to Your EC2 Instance: Use RDP to connect to your EC2 instance. Download stress test software’s like Prime95 and run the stress test. |
Alarm should trigger on defined thresholds. |
Windows Advanced Monitoring
| SNO | Description | Expected Result | ||||||||
|---|---|---|---|---|---|---|---|---|---|---|
| 1 | Step 1: Provision windows machine and apply the following tags
|
In CloudWatch alarms, we should be able to see the alarms created with following name AutoAlarm-Instance-id-AWS* | ||||||||
| 2 | Goto CloudWatch and Choose "Filter by Resource Group", select value as "test-monitoring-win-advanced" Note: Resource Groups should be created beforehand. |
Filtered resources should be listed in CloudWatch dashboard | ||||||||
| 3 | Check the EC2 dashboard, there will be some data in graphs | CloudWatch Dashboard should show some metrics. | ||||||||
| 4 | Run the Stress on the EC2 machine tagged with monitoring:win-advanced, stress should 100% of cpu or memory utilization. Connect to Your EC2 Instance: Use RDP to connect to your EC2 instance. Download stress test software’s like Prime95 and run the stress test. |
Alarm should trigger on defined thresholds. |
Detailed Code and Resources
Detailed code can be referred at the Infosys GitHub
https://github.com/Infosys-CodeStore-Repos/AWS-Automated-Monitoring-Tool
Also, cobalt asset Automated AWS Cloud Monitoring Solution can be referred in the cobalt store.
Conclusion
The automated cloud monitoring solution offers a scalable, efficient, and reliable approach to managing monitoring across multiple AWS accounts. By automating the configuration and deployment process, it reduces manual effort, enhances accuracy, and delivers significant cost savings. As cloud environments grow more complex, this solution provides a flexible and robust framework that can adapt to future needs, ensuring continued success and innovation in cloud monitoring.
References
Throughout the preparation of this whitepaper, information and insights were drawn from a range of reputable sources, including research papers, articles, and resources. Some of the key references that informed the content of this whitepaper include:
- https://docs.aws.amazon.com/prescriptive-guidance/latest/patterns/centralize-monitoring-by-using-amazon-cloudwatch-observability-access-manager.html
- https://achinthabandaranaike.medium.com/how-to-build-an-aws-cloudwatch-dashboard-using-terraform-7169311c5d73
- https://www.eginnovations.com/blog/aws-cloudwatch-monitoring-2/
- https://docs.aws.amazon.com/AmazonCloudWatch/latest/monitoring/Install-CloudWatch-Agent.html
- https://jazz-twk.medium.com/cloudwatch-agent-on-ec2-with-terraform-8cf58e8736de

Subscribe
To keep yourself updated on the latest technology and industry trends subscribe to the Infosys Knowledge Institute's publications
Count me in!


