Note : The above figures are based on IFRS (audited) financial statements
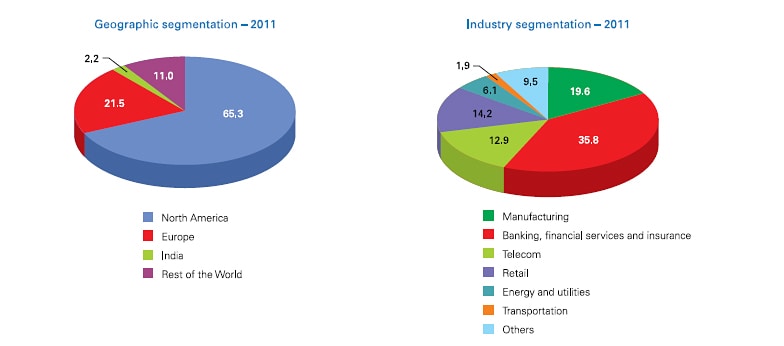
Geographic segmentation
in %
2011 |
2010 |
2009 |
2008 |
2007 |
|
North America |
65.3 |
65.8 |
63.2 |
62.0 |
63.3 |
Europe |
21.5 |
23.0 |
26.4 |
28.1 |
26.4 |
India |
2.2 |
1.2 |
1.3 |
1.3 |
1.6 |
Rest of the World |
11.0 |
10.0 |
9.1 |
8.6 |
8.7 |
Total |
100.0 |
100.0 |
100.0 |
100.0 |
100.0 |
Industry segmentation
in %
2011 |
2010 |
2009 |
2008 |
2007 |
|
Manufacturing |
19.6 |
19.8 |
19.7 |
14.7 |
13.5 |
Banking, financial services and insurance |
35.8 |
34.0 |
33.9 |
35.7 |
37.4 |
Banking and financial services |
27.7 |
26.3 |
26.7 |
28.5 |
30.2 |
Insurance |
8.1 |
7.7 |
7.2 |
7.2 |
7.2 |
Telecom |
12.9 |
16.1 |
18.1 |
21.6 |
19.3 |
Retail |
14.2 |
13.3 |
12.6 |
11.8 |
10.0 |
Energy and utilities |
6.1 |
5.9 |
5.7 |
5.2 |
5.3 |
Transportation and logistics |
1.9 |
2.0 |
2.3 |
2.5 |
2.4 |
Others |
9.5 |
8.9 |
7.7 |
8.5 |
12.1 |
Total |
100.0 |
100.0 |
100.0 |
100.0 |
100.0 |
Project type(1)
in %
2011 |
2010 |
2009 |
2008 |
2007 |
|
Fixed price |
40.3 |
38.5 |
35.4 |
31.0 |
26.7 |
Time and material |
59.7 |
61.5 |
64.6 |
69.0 |
73.3 |
Total |
100.0 |
100.0 |
100.0 |
100.0 |
100.0 |
(1) Excluding products
Service offering
in %
2011 |
2010 |
2009 |
2008 |
2007 |
|
Services |
|||||
Application Development and Maintenance |
39.0 |
41.3 |
42.4 |
45.4 |
48.0 |
Application Development |
16.0 |
18.0 |
20.5 |
21.7 |
23.1 |
Application Maintenance |
23.0 |
23.3 |
21.9 |
23.7 |
24.9 |
Business Process Management |
5.6 |
6.1 |
6.0 |
5.7 |
4.7 |
Consulting Services and Package Implementation |
25.5 |
24.4 |
24.9 |
23.8 |
21.1 |
Infrastructure Management |
6.3 |
7.2 |
6.3 |
4.9 |
4.4 |
Product Engineering Services |
2.4 |
2.2 |
2.2 |
1.6 |
1.6 |
Systems Integration |
5.4 |
4.2 |
3.6 |
2.8 |
2.3 |
Testing Services |
7.5 |
6.4 |
6.8 |
7.5 |
6.9 |
Others |
3.4 |
4.0 |
3.9 |
4.7 |
7.1 |
Total services |
95.1 |
95.8 |
96.1 |
96.4 |
96.1 |
Product revenues |
4.9 |
4.2 |
3.9 |
3.6 |
3.9 |
Total |
100.0 |
100.0 |
100.0 |
100.0 |
100.0 |
Note : The above figures are based on IFRS (audited) financial statements