The year at a glance
Indian GAAP – standalone
in Rs. crore, except per share data
| 2010 | 2009 | Growth (%) | |
Financial performance |
|||
| Income | 21,140 | 20,264 | 4.3 |
| Gross profit | 9,581 | 9,119 | 5.1 |
| Operating profit (PBIDTA) | 7,360 | 6,906 | 6.6 |
| Profit after tax(1) | 5,755 | 5,819 | (1.1) |
| EPS(1) (par value of Rs. 5/- each) : Basic | 100.37 | 101.65 | (1.3) |
| Diluted | 100.26 | 101.48 | (1.2) |
| Dividend Per share | 25.00 | 23.50 | 6.4 |
Financial position |
|||
| Capital expenditure | 581 | 1,177 | (50.6) |
| Fixed assets | 4,188 | 4,414 | (5.1) |
| Cash and cash equivalents (2) | 14,804 | 10,289 | 43.9 |
| Net current assets | 13,131 | 12,288 | 6.9 |
| Total assets | 22,268 | 17,846 | 24.8 |
| Debt | – | – | – |
| Net worth | 22,036 | 17,809 | 23.7 |
| Cash and cash equivalents / total assets (%) | 66.5 | 57.7 | – |
| Market capitalization | 1,50,110 | 75,837 | 97.9 |
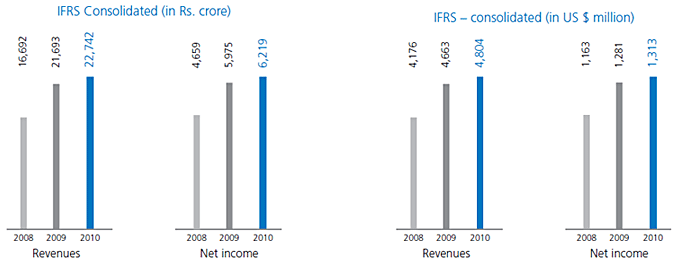
IFRS – consolidated
in Rs. crore, except per share data
Revenues |
22,742 | 21,693 | 4.8 |
| Gross profit | 9,722 | 9,158 | 6.2 |
| Operating income | 6,910 | 6,421 | 7.6 |
| Net income(3) | 6,219 | 5,975 | 4.1 |
| EPS(3) (par value of Rs. 5/- each) : Basic | 109.02 | 104.89 | 3.9 |
| Diluted | 108.90 | 104.71 | 4.0 |
in US $ million, except per share data
Revenues |
4,804 | 4,663 | 3.0 |
| Gross profit | 2,055 | 1,964 | 4.6 |
| Operating income | 1,460 | 1,374 | 6.2 |
| Net income(3) | 1,313 | 1,281 | 2.5 |
| EPS(3) (par value of Rs. 5/- each) : Basic | 2.30 | 2.25 | 2.2 |
| Diluted | 2.30 | 2.25 | 2.2 |
Notes : 1 crore equals 10 million
(1) Before exceptional Item
(2) Includes investment in liquid mutual funds of Rs. 3,507 crore for fiscal 2010.
(3) Includes income from sale of investments in OnMobile Systems Inc, USA of $11 million (Rs. 48 crore), net of transaction costs, for the financial year ended March 31, 2010.
(1) Before exceptional Item
(2) Includes investment in liquid mutual funds of Rs. 3,507 crore for fiscal 2010.
(3) Includes income from sale of investments in OnMobile Systems Inc, USA of $11 million (Rs. 48 crore), net of transaction costs, for the financial year ended March 31, 2010.
